As Texas districts prepare for the 2015-2016 school year, we analyzed the IMA purchasing data* to identify trends that could offer valuable insights for districts and publishers alike.
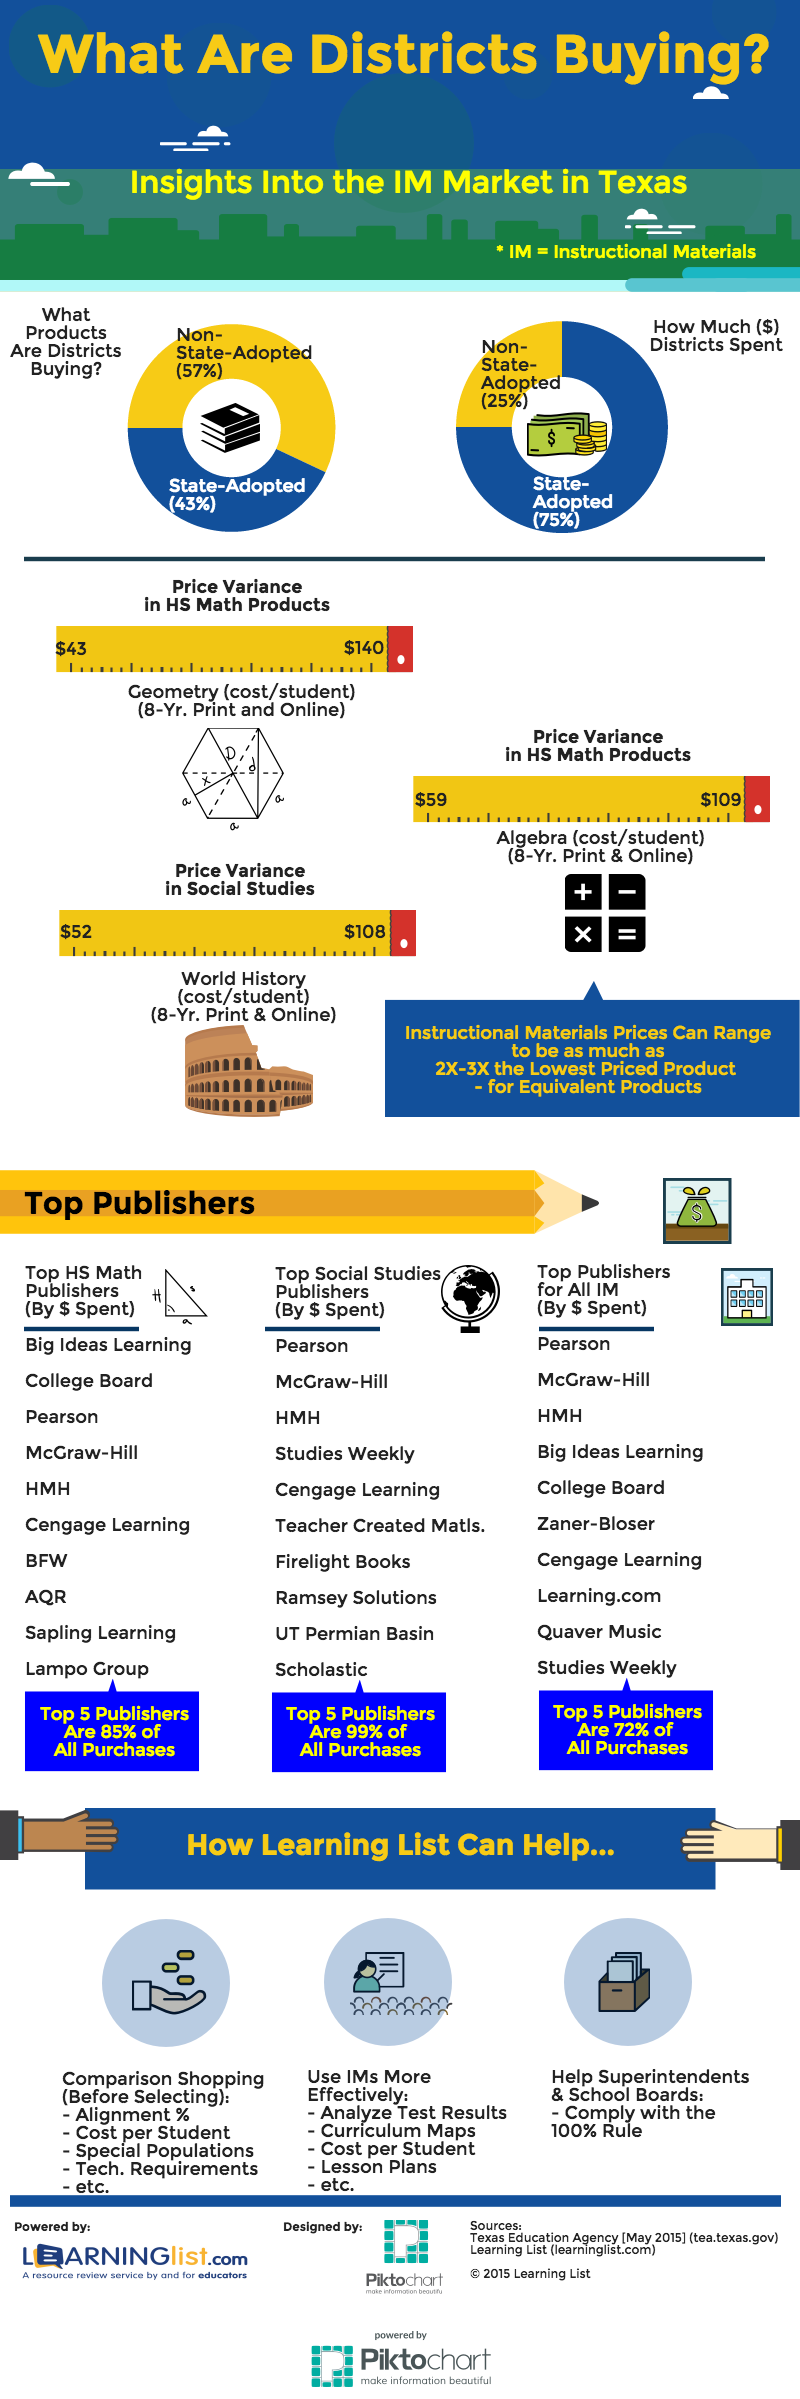
Take a look a this infographic (click here to download the PDF version or here for a high-resolution PNG file) to see:
- State-adopted vs. non-state adopted products purchased (by amount spent and by number of products purchased)
- Price Variance for High School Math Products (cost/student)
- Price Variance of Social Studies Products (cost/student)
- Top High School Math Publishers (by dollars spent)
- Top Social Studies Publishers (by dollars spent)
- Top Publishers for all IM Purchased (by dollars spent)
Conclusion: Districts are buying more non-adopted products than ever before, but spending more on state-adopted products. Product prices vary significantly within a grade and subject, even for products with similar alignment percentages. Smaller publishers are gaining market share in each of the subjects adopted, as more online products are being purchased. With reviews for well over 850 instructional materials from more than 85 publishers, Learning List makes comparison shopping easier to save districts significant time and money and help educators select the products that will best meet their students’ needs.

List of Statistics
* Data Source: TEA Instructional Materials Allotment Expenditures (May 2015)
© 2015 Learning List